Viva'sReef
Member
Is there a way to change the Graph range back to within a smaller sample set?
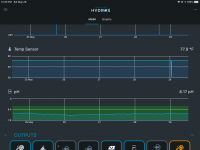
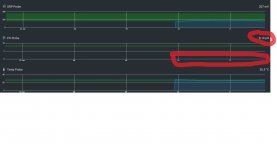
Example, my PH probe would display a range of 7 low, and 9 high but now it shows a range from 0 low to 10 high.
Temp is now showing a range from 30 low, to 90 high. So the graph just shows a straight line because the range is so far off from my set points.
Anyone else experiencing this? Know how to fix it?