Hi all
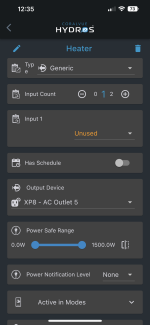
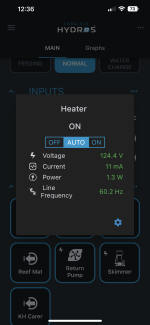
I’d really love to have the power monitoring data from my XP8 outlets graphed over time so I can see what my devices are consuming. I see the instantaneous info when clicking on a tile (per the pic attached) but I don’t want to sit and watch it to see spikes or changes over time. The data is here - you are already are monitoring it, I just want to see it graphed somewhere.
In my opinion the “power safe range” setting is a wild guess by the users without knowing what any historical data would be.
Pump data - a clean pump vs a dirty pump will draw different power. Heater data - is my heater really working or not.
This is a standard feature on the other system. They also have software recommendation for setting power safe ranges based on the historical data (it’s just statistical deviation calculations). I’m not even asking for that level of complexity. Just a simple graph of data that is already being monitored.
Thanks for your consideration and hopefully bumping this up the priority list for future updates.